Understand your customers to better keep them
Follow the evolution of your customer base, who buys, who comes back, who drops out — and why.
Already adopted by 150+ e-retailers in France
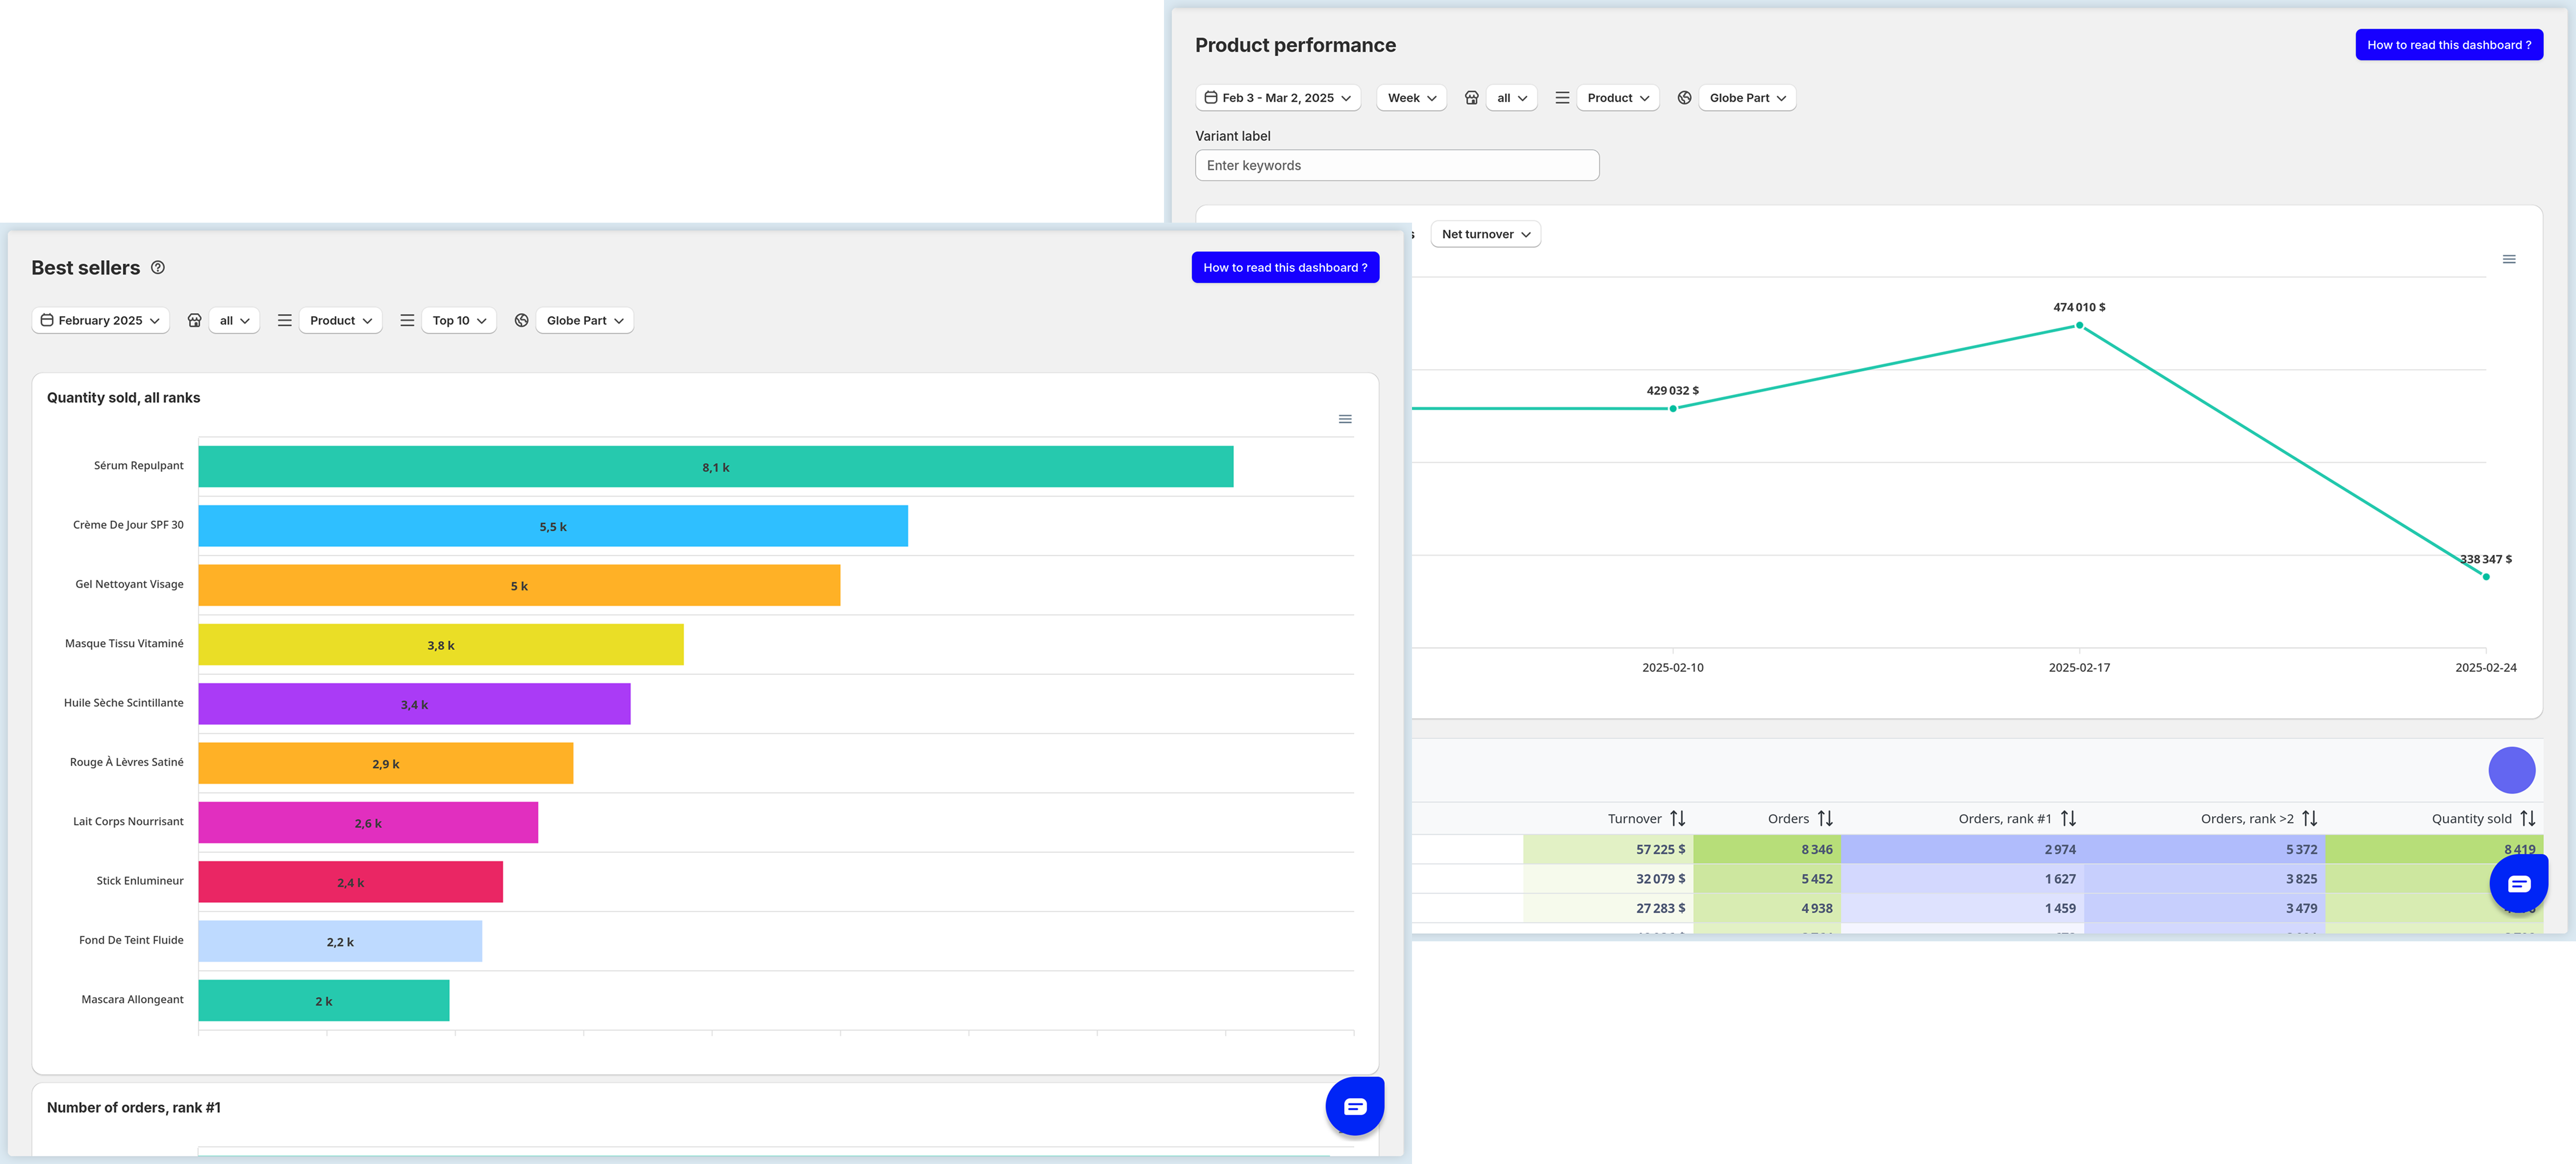
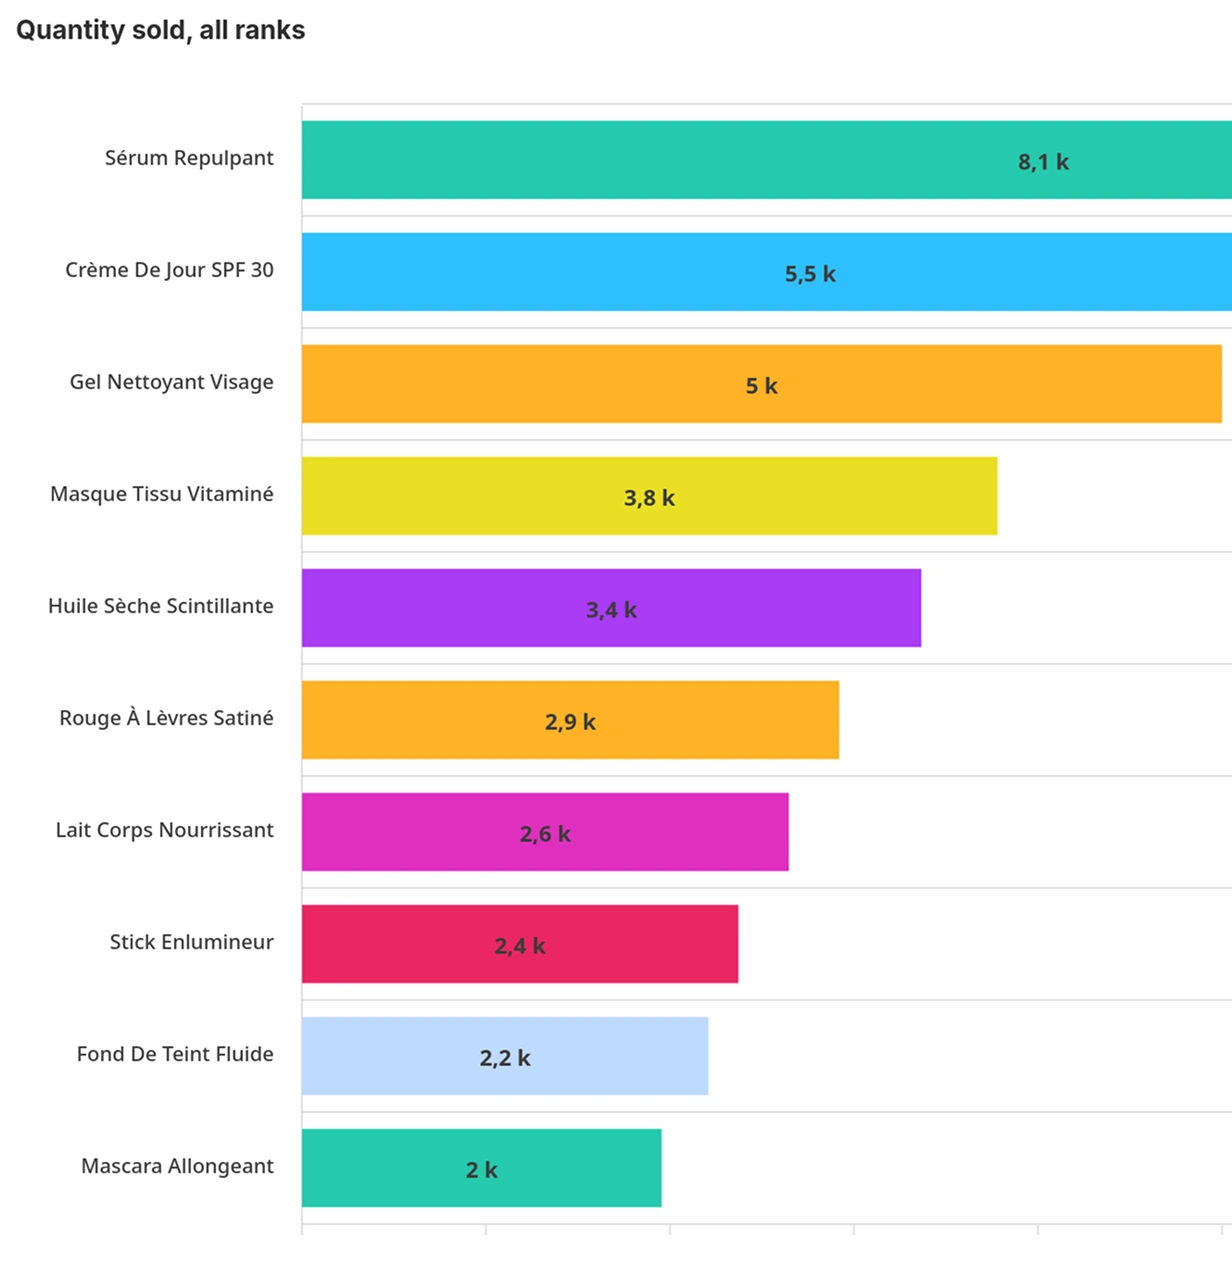
Your best sellers, in detail
This table shows you for each product:
→ the total volume sold,
→ the number of orders where it appears as the first choice,
→ but also if it is often purchased in 2nd, 3rd or 5th position.
You're no longer content with knowing what's selling—you understand how your products fit into the customer basket.
An essential tool for prioritizing your product highlights, bundles and recommendations.
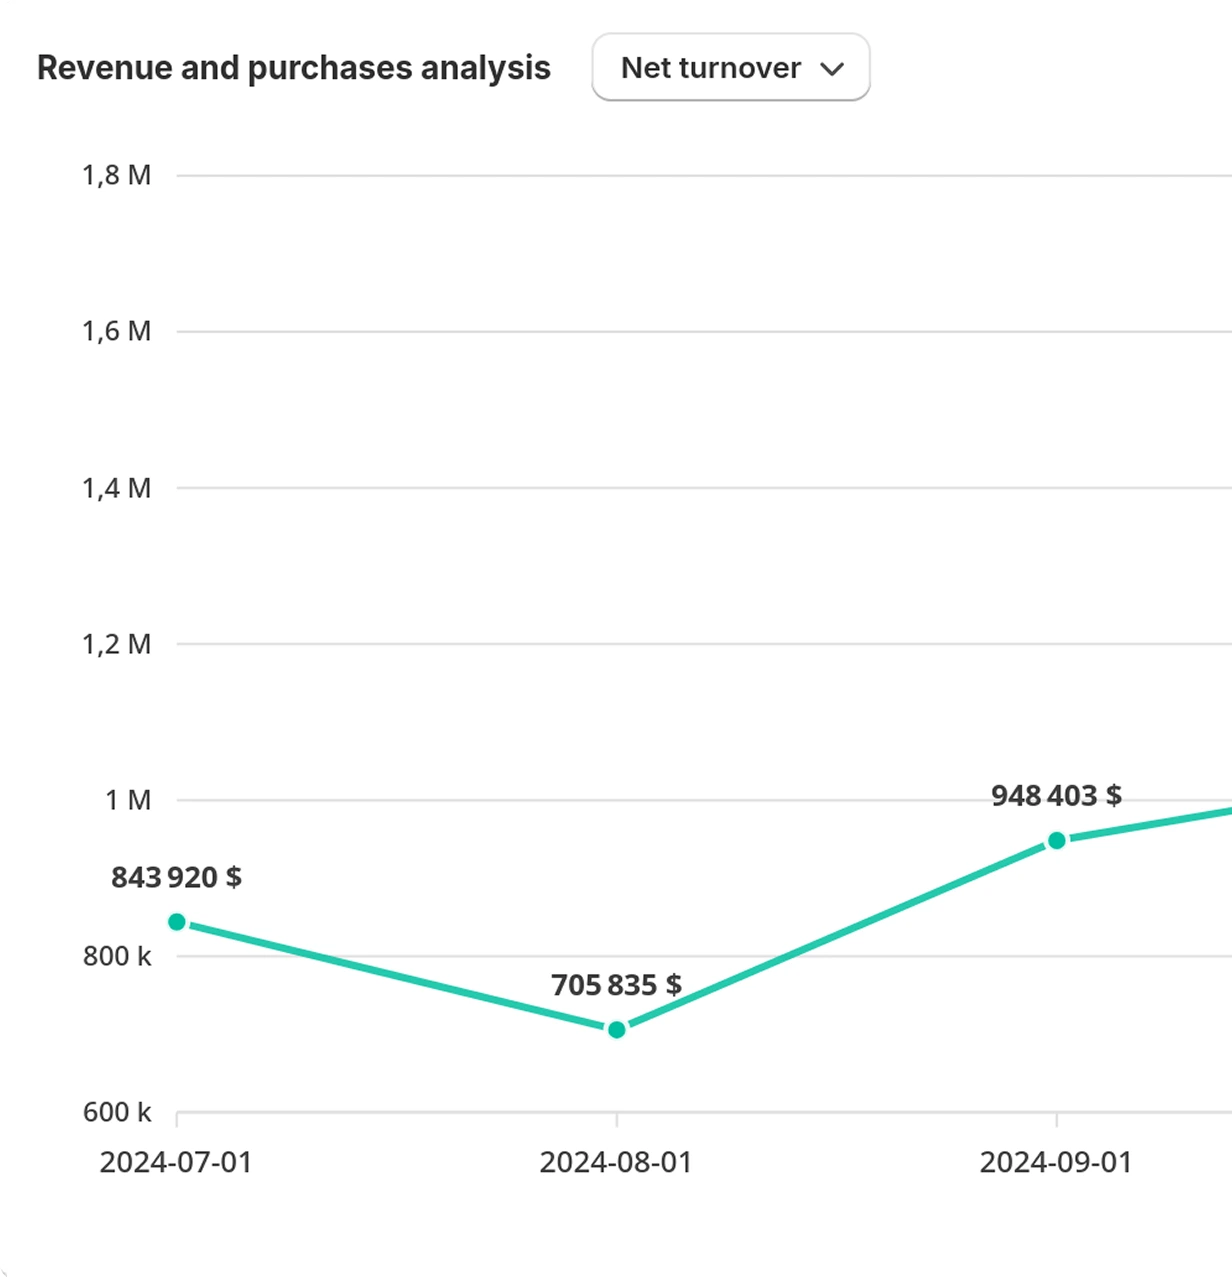
Product performance, month by month
Another table shows you the evolution of turnover by product, month after month.
You spot:
→ products that generate regular sales,
→ seasonal peaks,
→ unexpected dropouts.
One filter per product, one line per month, and control becomes simple.
And with Dilly, it all becomes interactive
Dilly is your AI co-pilot, connected to your dashboards, who answers your questions in natural language and offers you:
- clear analyses,
- concrete recommendations,
- benchmarks to help you locate yourself
Examples:
“Which product is purchased the most first?”
“What products have been losing momentum over the last 3 months?”
“What products generate the most repeat sales?”
“How much revenue did product x generate in March?”
Dilly gives you the answer, the numbers... and tells you what to do.