Understand your customers to better keep them

Follow the evolution of your customer base, who buys, who comes back, who drops out — and why.

Tableau de bord d'analyse de données centré sur un tableau de la "Lifetime value" (valeur vie client), avec des graphiques de performance sur les côtés.

Already adopted by 150+ e-retailers in France

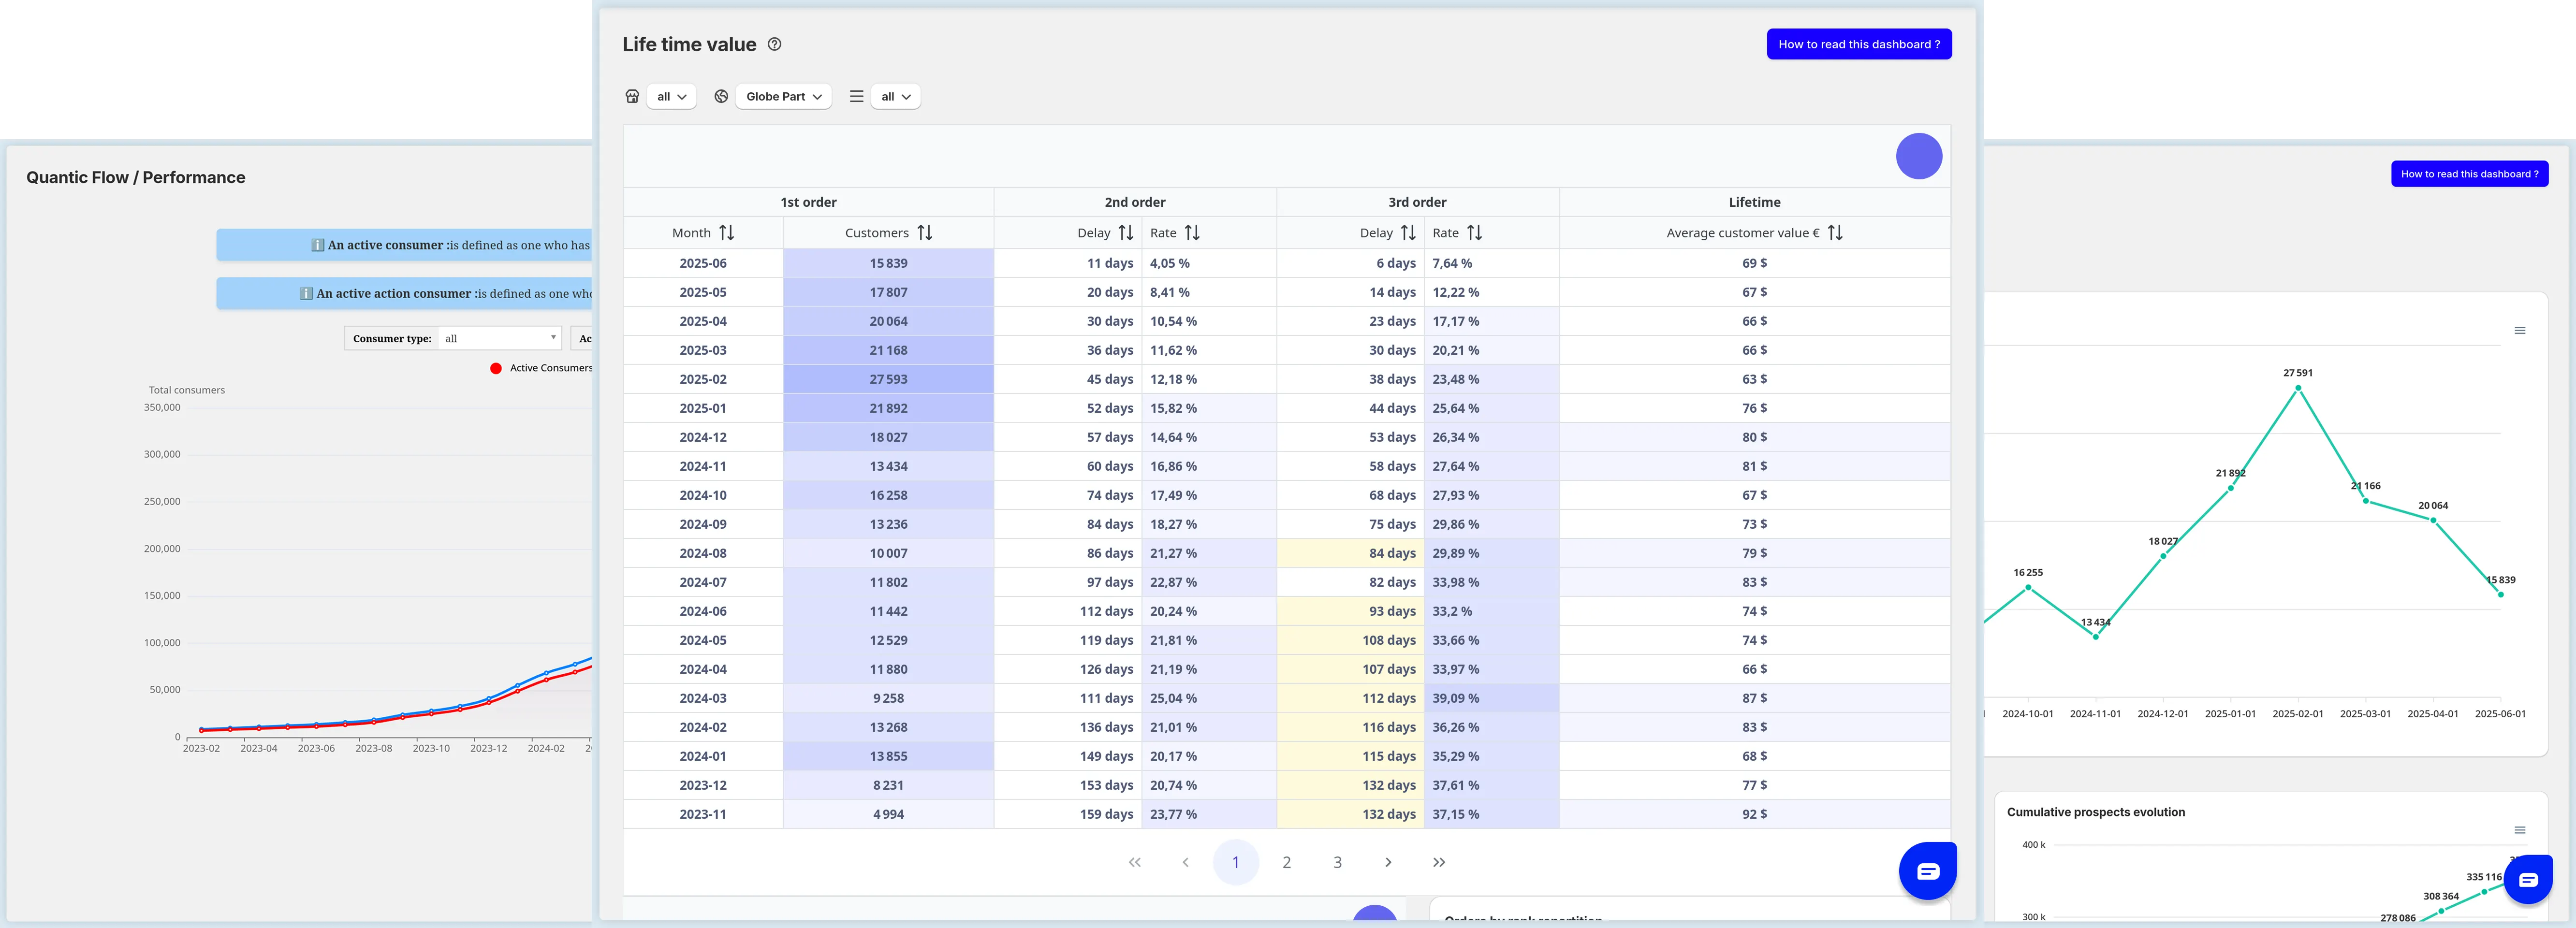
The LTV table, to see the distance

Follow month by month:
- The volume of new customers
- The deadlines between the 1st, 2nd, and 3rd order
- Repurchase rates
- The average customer value (LTV) over time
- The number of customers who place a 2nd, 3rd, 4th and 5th order or more

Cohort by cohort, you follow the progression of loyalty, more than a repeat rate, it's a behavioral reading of customer retention.

Tableau de données comparant la performance des canaux marketing. Les colonnes affichent le nom du canal (ex: "Organic Search", "Paid Instagram"), le nombre de clients, et la valeur moyenne du premier panier. "Organic Search" apporte le plus de clients (8692).
Graphique en anneau illustrant la répartition de 384 268 commandes par rang d'achat. Il montre que la grande majorité des commandes (78,8%) sont des premiers achats, tandis que les achats répétés (deuxième, troisième, etc.) représentent des parts beaucoup plus faibles.

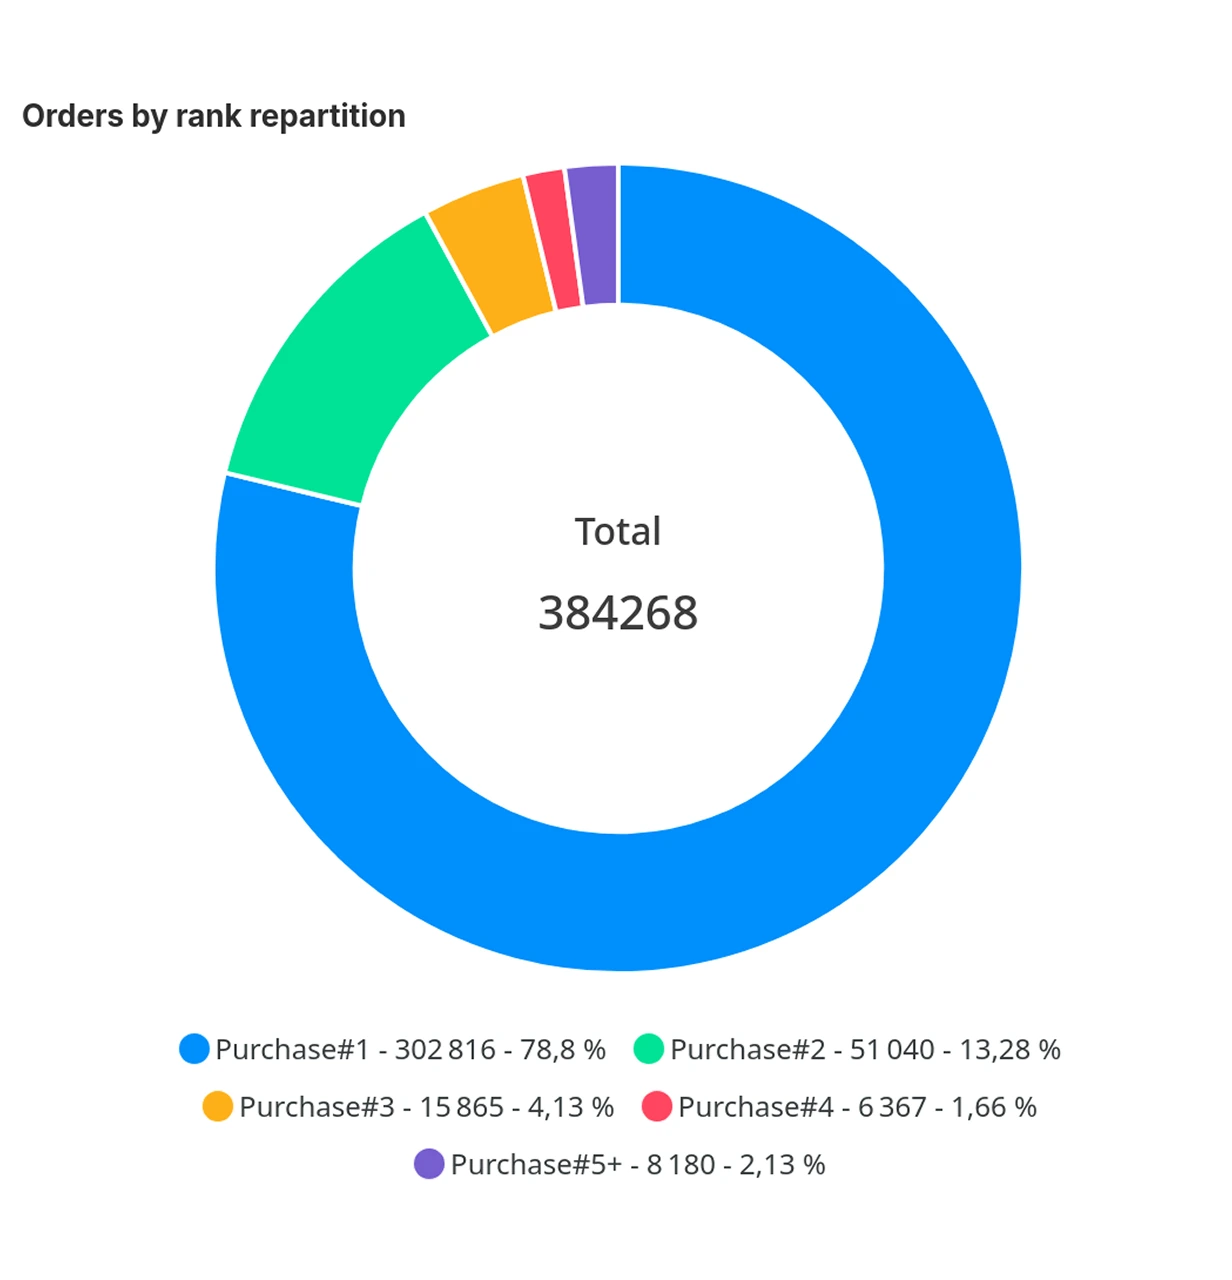
The structure of your sales at a glance

The ring chart shows you the structure of your sales volume:
- share of the first orders,
- part of the repeat (2nd to 4th),
- share of ultra-recurring customers (5+).
It's an immediate read to find out if your growth is based on acquisition... or loyalty.

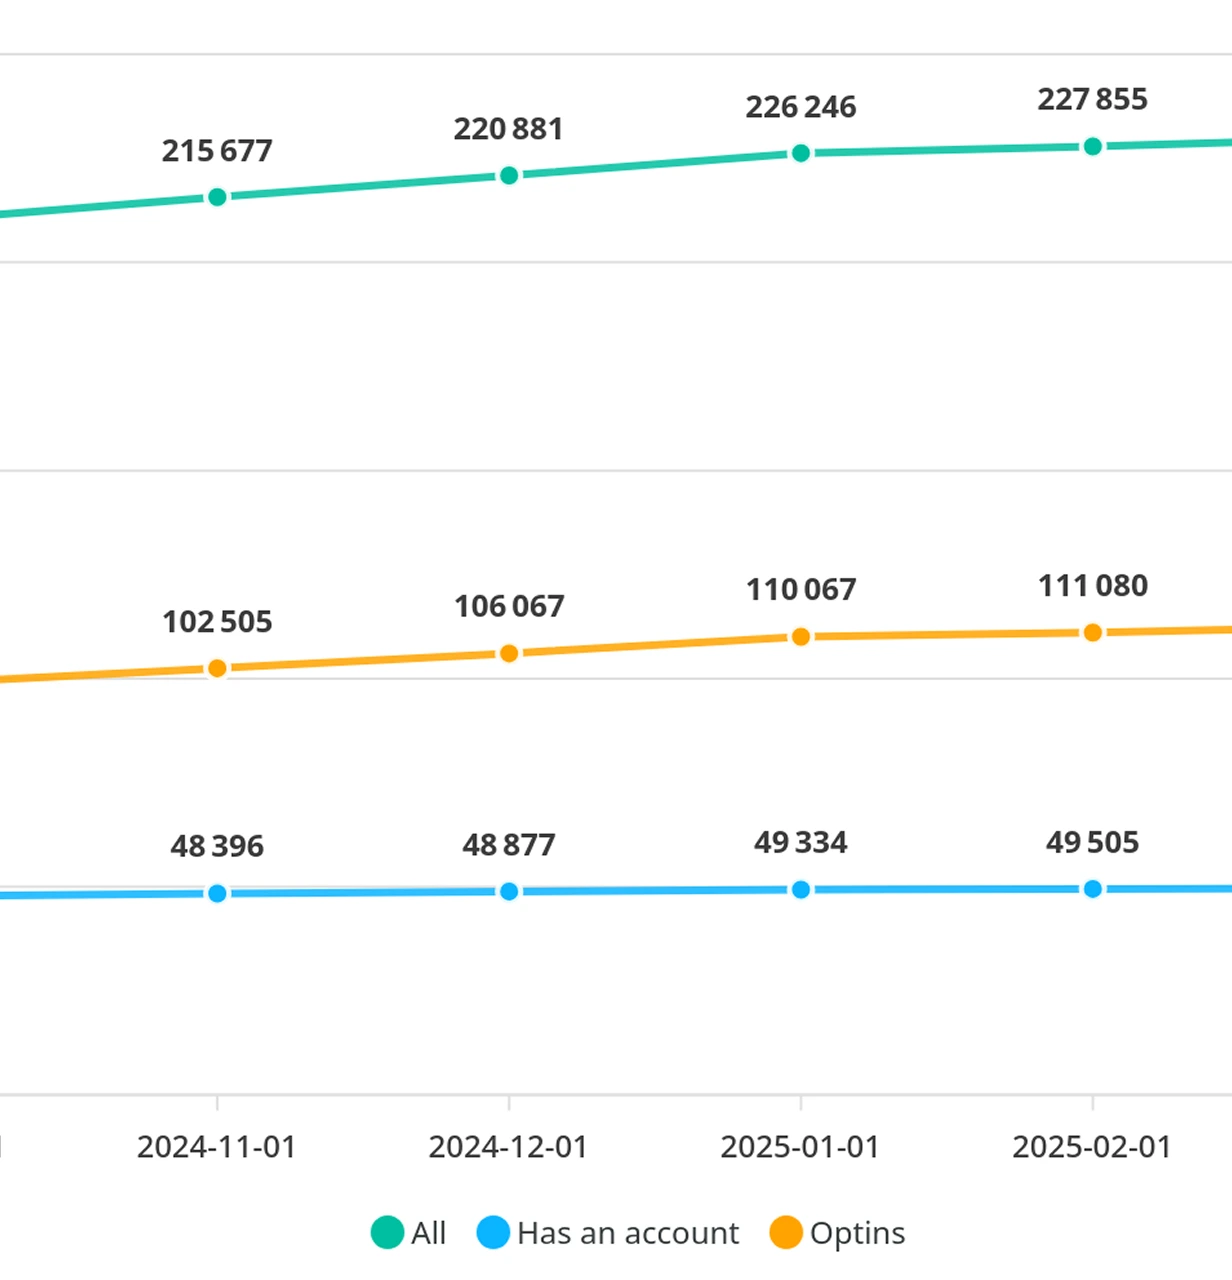
The customer base, finally readable

This dashboard gives you a complete and actionable overview of your database:
- customers vs prospects,
- opt-ins available,
- monthly evolution of the acquisition,
- cumulative evolution of databases (customers & prospects).
You are no longer just looking at the size of your base, but at its real quality.

Graphique en ligne comparant la croissance de trois métriques de novembre 2024 à février 2025. La ligne du total "All" (verte) est la plus élevée à 227 855, suivie par les "Optins" (orange) à 111 080, et enfin ceux qui ont un compte "Has an account" (bleue) à 49 505.
Graphique en ligne de croissance cumulative comparant le nombre total de consommateurs ("Consumers" en bleu) et le nombre de consommateurs actifs ("Active Consumers" en rouge) de novembre 2023 à début 2025. Les deux courbes sont ascendantes et l'écart entre elles s'agrandit avec le temps.

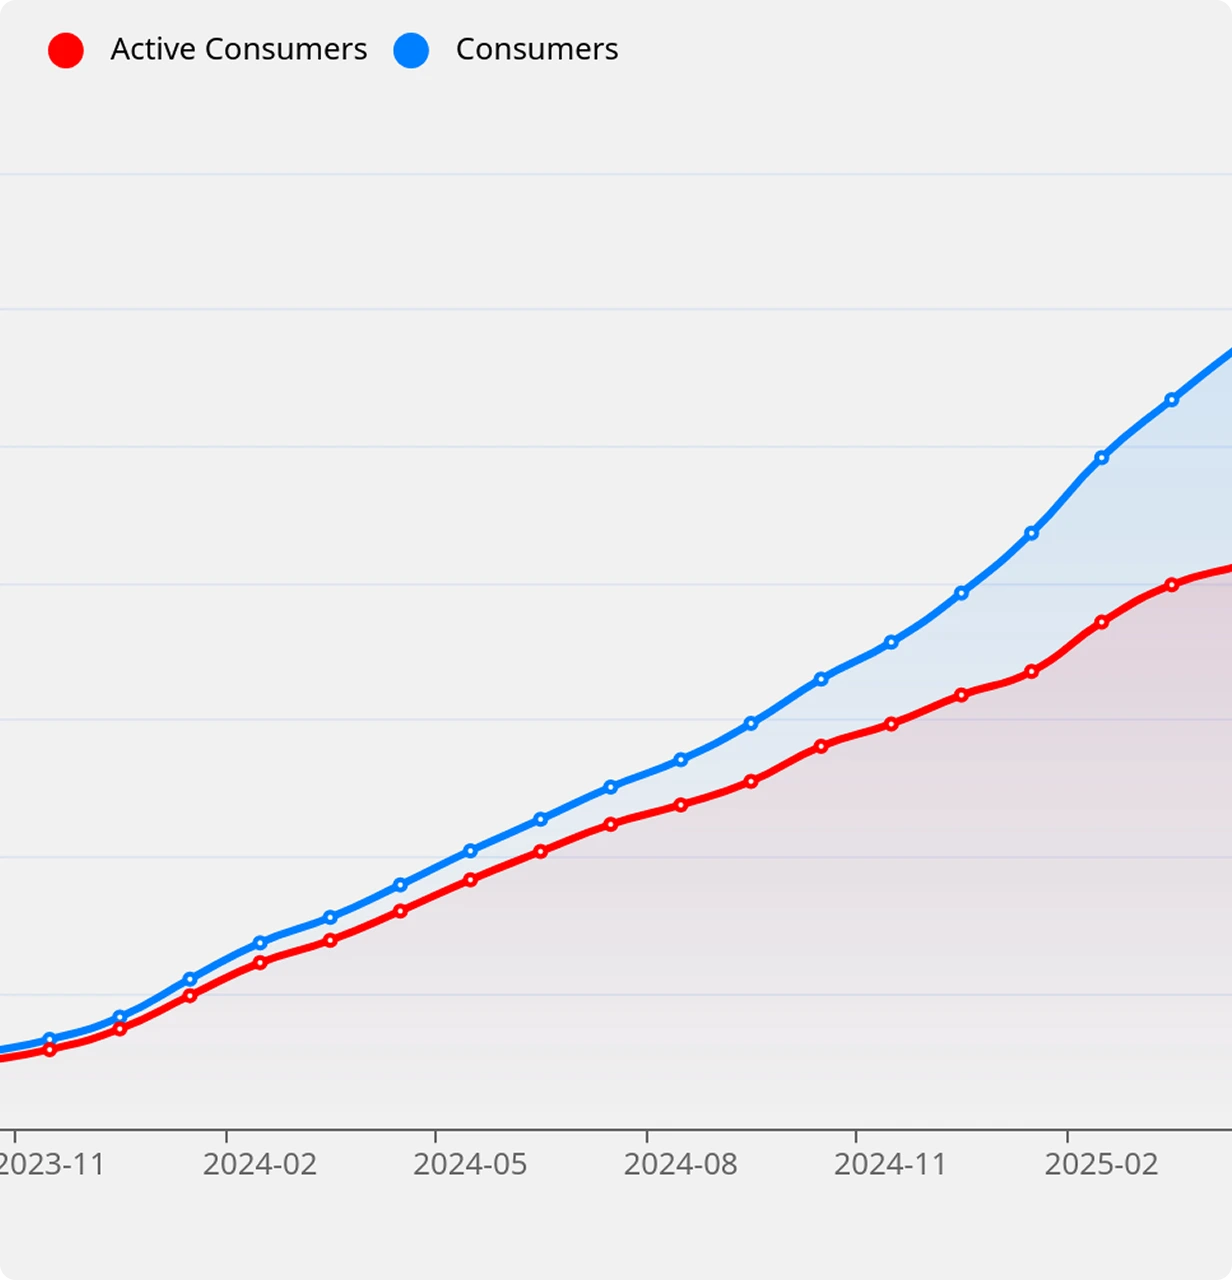
Active, dormant: where are you really at?

Visualize the evolution of your active consumers.
 You see, over the last 12 months:
- the growth of active customers (per purchase),
- the gap with your entire base,
- and the real activation rate of your customers.
Ideal for understanding if your CRM strategy is building loyalty... or stagnating.

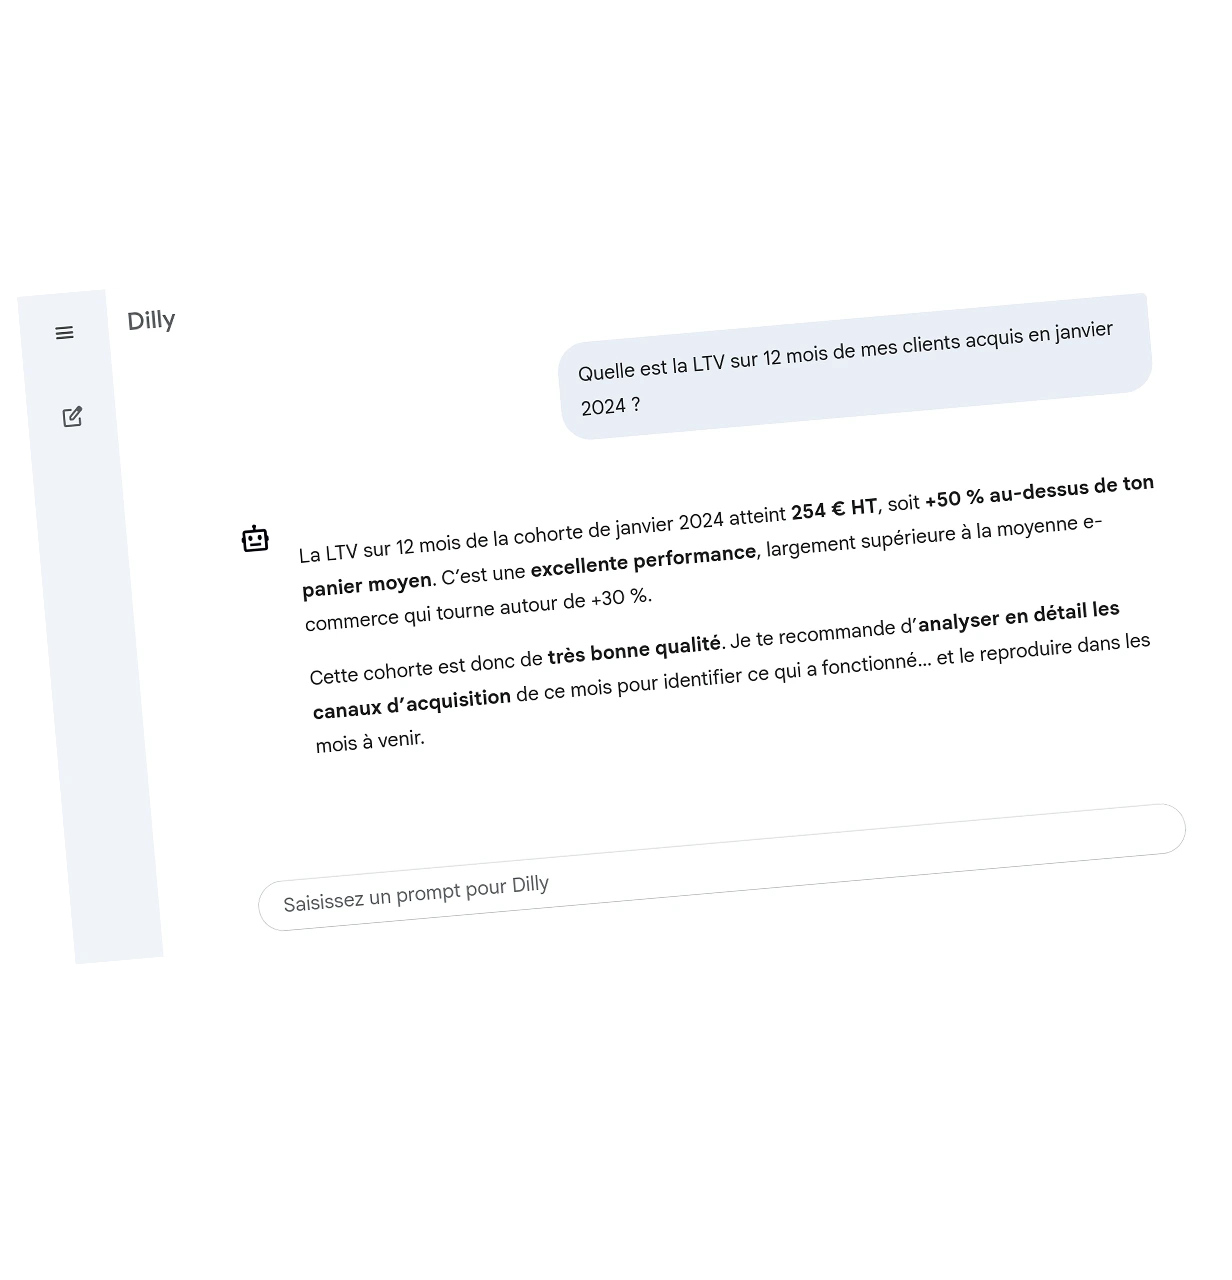
Dilly, the AI that turns your customer data into levers

And to go further, Dilly accompanies you.
 It is your AI co-pilot, connected to your dashboards, who answers your questions in natural language and offers you:
- clear analyses,
- concrete recommendations,
- benchmarks to help you locate yourself

Examples:
“Is my repurchase rate down among February customers?”
 “What customer segment has generated the highest LTV over the last 3 months?”

“What is my lead activation rate?”

Dilly reads the data for you. And tells you what to do.

By clicking you confirm that you accept our terms and conditions.
Thank you! Your request has been received!
Whoops! There was a problem submitting the form.
Capture d'écran d'une interface d'assistant IA nommée "Dilly". L'utilisateur demande la LTV (valeur vie client) sur 12 mois pour la cohorte de janvier 2024. L'IA répond que celle-ci est de 254€ HT, une "excellente performance", et recommande d'analyser les canaux d'acquisition de cette période.

They tested. They won.

“The solution is really powerful, it really helps to avoid holes in the racket. The business model is also suitable for brands since it is based on increments. So it's a 100% win.”
Logo de flowrette
Flowrette
“Everything is set up automatically, and the app is activated in one click. Super easy to launch! It takes some time to fully understand some dashboards, but the set is complete and reliable.”
Logo de rivedroite
Right bank
“Very happy with our experience with QuanticFy. The results are constantly growing and far exceed the objectives set! Thanks to Emna for her great help:)”
Logo de mon shampoing
My shampoo

No more spending hours on Excel. We already have the answers.